The NOAA annual greenhouse gas index (AGGI).

Introduction
The AGGI is a measure of the climate-warming influence of long-lived trace gases and how that influence has changed since the onset of the industrial revolution. The index was designed to enhance the connection between scientists and society by providing a normalized standard that can be easily understood and followed. The warming influence of long-lived greenhouse gases is well understood by scientists and has been reported by NOAA through a range of national and international assessments. Nevertheless, the language of scientists often eludes policy makers, educators, and the general public. This index is designed to help bridge that gap. The AGGI provides a way for this warming influence to be presented as a simple index.
Increases in the abundance of atmospheric greenhouse gases since the industrial revolution are mainly the result of human activity and are largely responsible for the observed increases in global temperature [IPCC 2014]. However, climate projections have model uncertainties that overwhelm the uncertainties in greenhouse gas measurements. We present here an index that is directly proportional to the change in the direct warming influence since 1750 (also known as climate forcing) supplied from these gases. Because it is based on the observed amounts of long-lived greenhouse gases in the atmosphere, this index contains relatively little uncertainty.
The Intergovernmental Panel on Climate Change (IPCC) defines climate forcing as “An externally imposed perturbation in the radiative energy budget of the Earth climate system, e.g. through changes in solar radiation, changes in the Earth albedo, or changes in atmospheric gases and aerosol particles.” Thus climate forcing is a “change” in the status quo. IPCC takes the pre-industrial era (chosen as the year 1750) as the baseline. The perturbation to direct climate forcing (also termed “radiative forcing”) that has the largest magnitude and the least scientific uncertainty is the forcing related to changes in the atmospheric global abundance of long-lived, well mixed greenhouse gases, in particular carbon dioxide (CO2), methane (CH4), nitrous oxide (N2O), and halogenated compounds (mainly CFCs).
Measured global atmospheric abundances of greenhouse gases are used to calculate changes in radiative forcing beginning in 1979 when NOAA's global air sampling network expanded significantly. The change in annual average total radiative forcing by all the long-lived greenhouse gases since the pre-industrial era (1750) is also used to define the NOAA Annual Greenhouse Gas Index (AGGI), which was introduced in 2006 based on measurements through 2004 [Hofmann et al., 2006a] and has been updated annually since.
Observations
The NOAA monitoring program provides high-precision measurements of the global abundance and distribution of long-lived greenhouse gases that are used to calculate changes in radiative climate forcing.
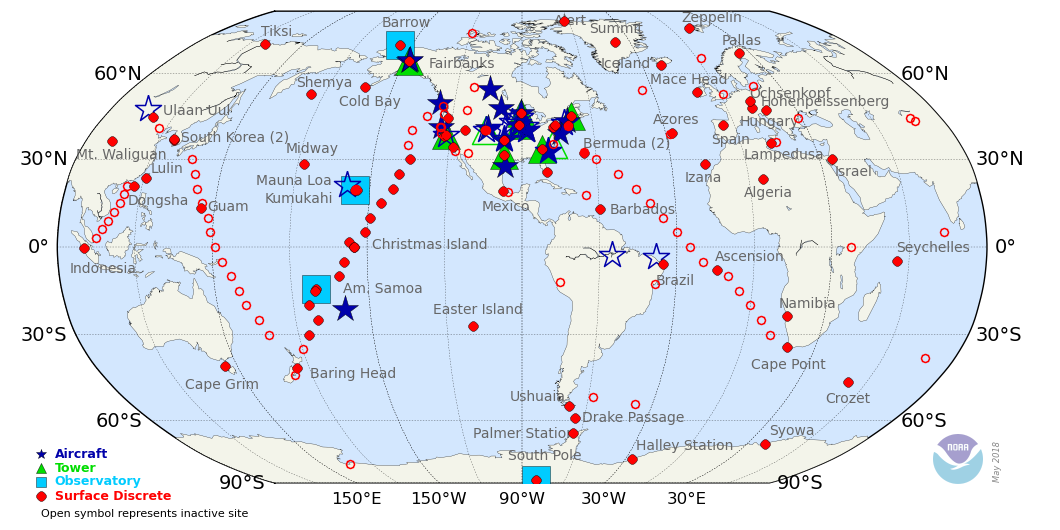
Air samples are collected through the NOAA/ESRL global air sampling network, including a cooperative program for the carbon gases which provides samples from ~80 global background air sites, including measurements at 5 degree latitude intervals from ship routes (see Figure 1).
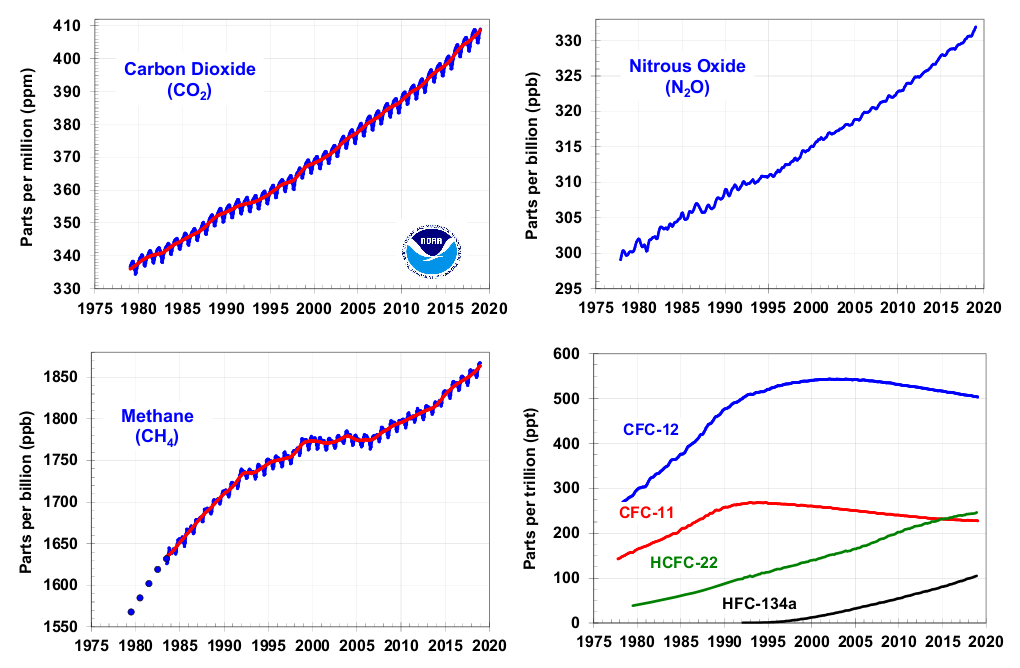
Weekly data are used from a subset of these sites to create a smoothed north-south latitude profile from which a global average is calculated (Figure 2). The atmospheric abundance of CO2 has increased by an average of 1.83 ppm per year over the past 40 years (1979-2018). The CO2 increase is accelerating — while it averaged about 1.6 ppm per year in the 1980s and 1.5 ppm per year in the 1990s, the growth rate increased to 2.3 ppm per year during the last decade (2009-2018). The annual CO2 increase from 1 Jan 2018 to 1 Jan 2019 was 2.5 ± 0.1 ppm (see https://www.esrl.noaa.gov/gmd/ccgg/trends/global.html), which is slightly higher than the average of the previous decade, and much higher than the two decades before that.
The growth rate of methane declined from 1983 until 1999, consistent with its concentration approaching steady-state, assuming no trend in CH4 lifetime. Superimposed on this decline is significant interannual variability in growth rates [Dlugokencky et al., 1998, 2003]. From 1999 to 2006, the atmospheric CH4 burden was nearly constant, but since 2007, globally averaged CH4 has been increasing again. Causes for the increase during 2007-2008 included warm temperatures in the Arctic in 2007 and increased precipitation in the tropics during 2007 and 2008 [Dlugokencky et al., 2009]. Isotopic measurements argue for continued increasing microbial emissions after 2008 (e.g., likey from wetlands or agriculture) [Schaefer et al., 2016; Nisbet et al., 2019]. Since 2013, the global within-year increase (1 Jan to 1 Jan) in methane has become even larger, averaging 8.9 ± 2.8 ppb yr-1 through 2018 compared to an average annual increase of 5.7 ± 1.2 ppb yr-1 between 2007 and 2013 (https://www.esrl.noaa.gov/gmd/ccgg/trends_ch4/). The atmospheric burden of nitrous oxide continues to increase slowly over time, with an average rate of 1.0 ppb yr-1 over the past decade. Radiative forcing from the sum of observed CFC changes ceased increasing in about 2000 and continued to decline through 2018 [Montzka et al., 2011], despite increases in emissions of CFC-11 in recent years [Montzka et al., 2018]. This continued decline is a response to global controls placed on CFC production and trade by the fully adjusted and amended Montreal Protocol on Substances that Deplete the Ozone Layer.
Radiative Forcing Calculations
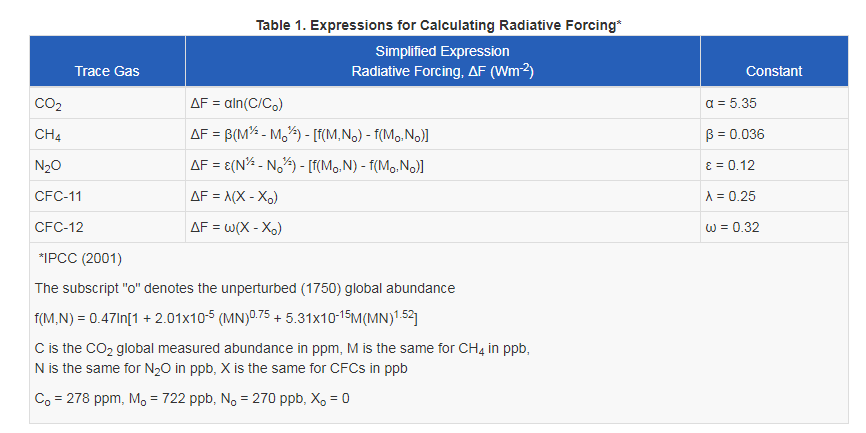
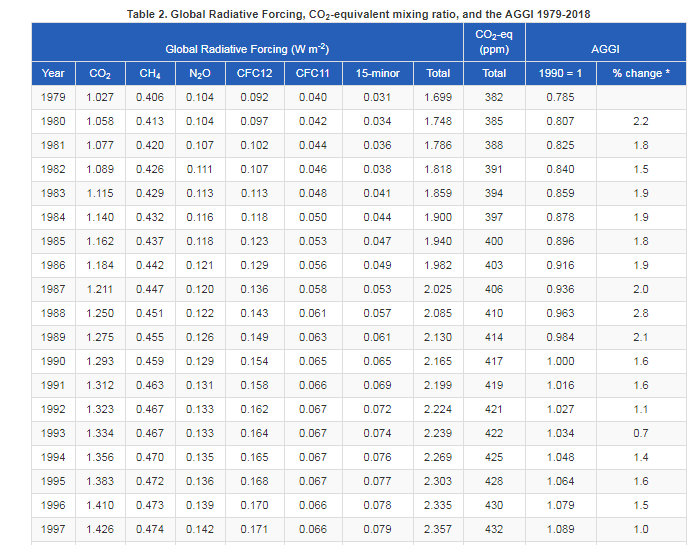
To determine the total radiative forcing of the greenhouse gases, we have used IPCC [Ramaswamy et al., 2001] recommended expressions to convert greenhouse gas global abundance changes, relative to 1750, to instantaneous radiative forcing (see Table 1). These empirical expressions are derived from atmospheric radiative transfer models and generally have an uncertainty of about 10%. The uncertainties in the global average abundances of the long-lived greenhouse gases are much smaller (<1%).
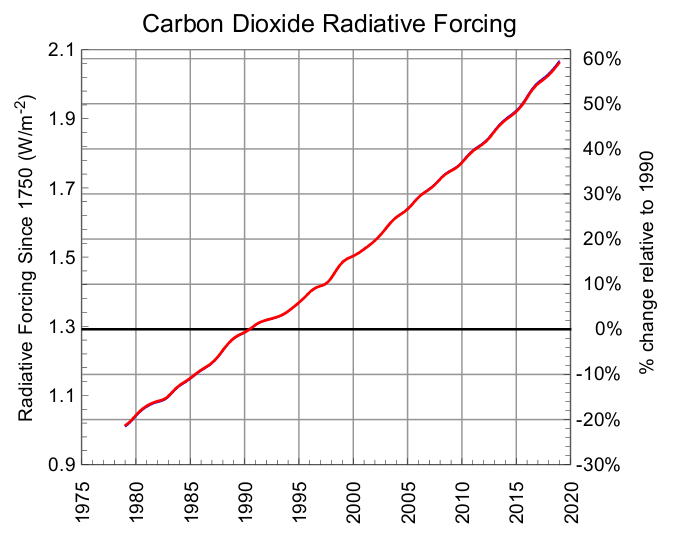
Because we seek an index that is accurate, only direct forcing from these gases has been included. Model-dependent feedbacks, for example, due to water vapor and ozone depletion, are not included. Other spatially heterogeneous, short-lived, climate forcing agents, such as aerosols and tropospheric ozone, have uncertain global magnitudes and also are not included here to maintain accuracy. Figure 3 shows the results for carbon dioxide global monthly averages for 1979-2018. An index based on the total of these contributions to radiative forcing would be similar to the Consumer Price Index, for example. It would include all the important components but not all the components of climate forcing. In contrast to climate model calculations, the results reported here are based mainly on measurements of long-lived, well-mixed gases and have small uncertainties.
Click on image to view full size figure.
2018 Results
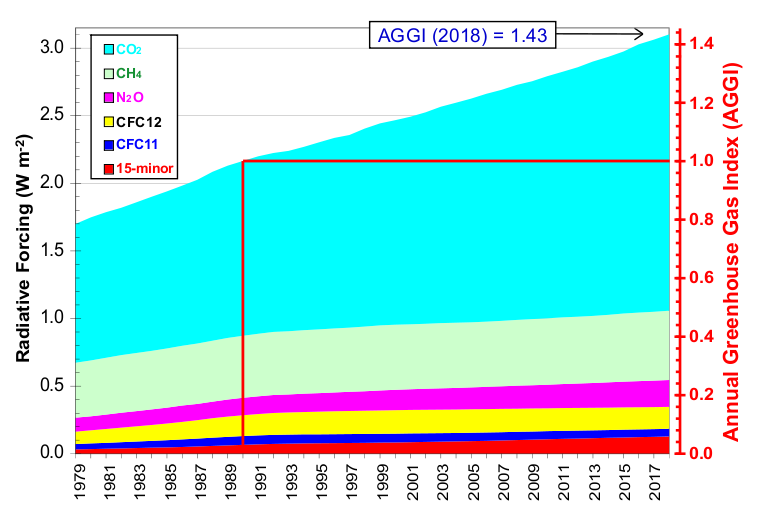
Figure 4 shows radiative forcing for the major gases and a set of 15 minor long-lived halogenated gases (CFC-113, CCl4, CH3CCl3, HCFCs 22, 141b and 142b, HFCs 134a, 152a, 23, 143a, and 125, SF6, and halons 1211, 1301 and 2402). Except for the HFCs and SF6, which do not contain chlorine or bromine, these gases are also ozone-depleting gases and are regulated by the Montreal Protocol. As expected, CO2 dominates the total forcing with methane and the CFCs becoming relatively smaller contributors to the total forcing over time. The five major greenhouse gases account for about 96% of the direct radiative forcing by long-lived greenhouse gas increases since 1750. The 15 minor halogenated gases contribute The remaining 4%.
Click on image to view full size figure.
Of the five long-lived greenhouse gases, CO2 and N2O are the only ones that continue to increase at regular rates over decades. Radiative forcing from CH4 increased since 2007 after remaining nearly constant from 1999 to 2006. While the radiative forcing of the long-lived, well-mixed greenhouse gases increased 43% from 1990 to 2018 (by ~0.94 watts m-2), CO2 has accounted for about 81% of this increase (~0.75 watts m-2). Had the ozone-depleting gases not been regulated by the Montreal Protocol and its amendments, it is estimated that climate forcing would have been as much as 0.3 watt m-2 greater in 2010 [Velders et al., 2007], or more than half of the increase in radiative forcing due to CO2 alone since 1990. The recent Kigali Amendment to the Montreal Protocol controls future production of HFCs, which are substitutes for CFCs and other ozone-depleting gases, to ensure that radiative forcing for these substitutes does not increase substantially in the future. Of the ozone-depleting gases and their substitutes, the largest contributors to direct warming in 2018 were CFC-12, followed by CFC-11, HCFC-22, CFC-113 and HCFC-134a. Although the concentration of HCFC-22 in the remote atmosphere surpassed that of CFC-11 by the end of 2015 (Figure 2), the radiative forcing arising from HCFC-22 is still only 86% of that from CFC-11 because CFC-11 is more efficient at trapping infrared radiation on a per molecule basis.
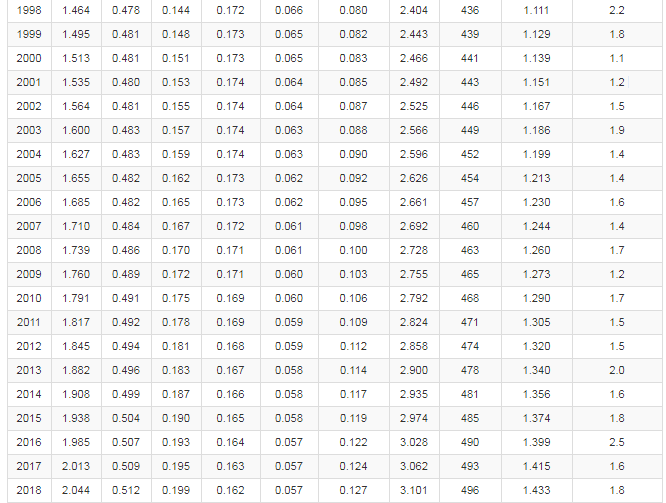
The Annual Greenhouse Gas Index (AGGI) is defined as the ratio of the total direct radiative forcing due to long-lived greenhouse gases for any year for which adequate global measurements exist to that which was present in 1990. 1990 was chosen because it is the baseline year for the Kyoto Protocol (and the publication year of the first IPCC Scientific Assessment of Climate Change). This index, shown with the direct radiative forcing values in Table 2 and on the right-hand axis of Figure 4, is a measure of the interannual changes in conditions that affect carbon dioxide emission and uptake, methane and nitrous oxide sources and sinks, the decline in the atmospheric abundance of ozone-depleting chemicals related to the Montreal Protocol, and the increase in their substitutes (HCFCs and HFCs). Most of this increase is related to CO2. For 2018, the AGGI was 1.43 (representing an increase in total direct radiative forcing of 43% since 1990). The increase in radiative forcing from CO2 alone since 1990 was nearly 58% (see Fig. 3). The decline in the CFCs has tempered the increase in net radiative forcing. The AGGI is updated each spring when air samples from all over the globe for the previous year have been obtained and analyzed.
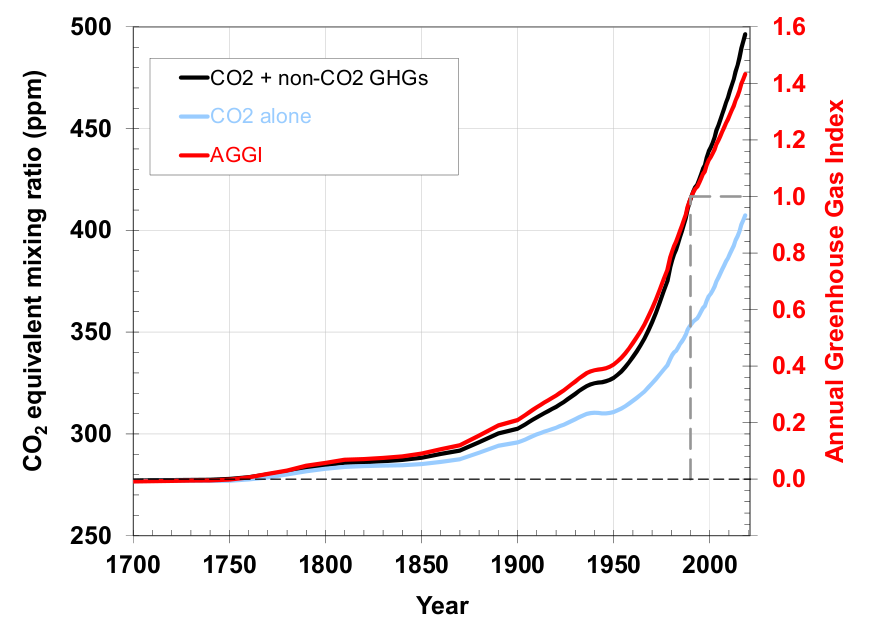
Changes in radiative forcing before 1978 are derived from atmospheric measurements of CO2, started by C.D. Keeling [Keeling et al., 1958], and from measurements of CO2 and other greenhouse gases in air trapped in snow and ice in Antarctica and Greenland [Etheridge et al., 1996; Butler et al,, 1999]. These results define atmospheric composition changes going back to 1750 and radiative forcing changes since preindustrial times (Figure 4). This longer-term view shows how increases in greenhouse gas concentrations over the past ~70 years (since 1950) have accounted for three-fourths (75%) of the total increase in the AGGI over the past 260 years.
Click on image to view full size figure.
Click here to download this table as comma separated values (csv).
Click here to download measured global annual mean dry-air mole fractions used in deriving the radiative forcing values provided in Table 2 and the AGGI.
References
- Battle, M., M. Bender, T. Sowers, P.P. Tans, J.H. Butler, J.W. Elkins, J.T. Ellis, T. Conway, N. Zhang, P. Lang, and A.D. Clarke, (1996) Atmospheric gas concentrations over the past century measured in air from firn at the South Pole, Nature, 383, 231-235.
- Butler, J.H., M. Battle, M. Bender, S.A. Montzka, A.D. Clarke, E.S. Saltzman, C. Sucher, J. Severinghaus, J.W. Elkins, (1999), A twentieth century record of atmospheric halocarbons in polar firn air, Nature, 399, 749-755.
- Dlugokencky, E. J., K. A. Masarie, P. M. Lang, and P. P. Tans, (1998) Continuing decline in the growth rate of the atmospheric methane burden, Nature, 393, 447-450.
- Dlugokencky, E. J., S. Houweling, L. Bruhwiler, K. A. Masarie, P. M. Lang, J. B. Miller, and P. P. Tans, (2003), Atmospheric methane levels off: Temporary pause or a new steady-state?, Geophys. Res. Lett., 19, doi:10.1029/2003GL018126.
- Dlugokencky, E.J., R.C. Myers, P.M. Lang, K.A. Masarie, A.M. Crotwell, K.W. Thoning, B.D. Hall, J.W. Elkins, and L.P Steele, (2005), Conversion of NOAA atmospheric dry air CH4 mole fractions to a gravimetrically-prepared standard scale, J. Geophys. Res., 110, D18306, doi:10.1029/2005JD006035.
- Dlugokencky, E.J., L. Bruhwiler, J.W.C. White, L.K. Emmons, P.C. Novelli, S.A. Montzka, K.A. Masarie, P.M. Lang, A.M. Crotwell1, J.B. Miller, and L.V. Gatti, (2009), Observational constraints on recent increases in the atmospheric CH4 burden,Geophys. Res. Lett., 36, L18803, doi:10.1029/2009GL039780
- Etheridge, D.M., L.P. Steele, R.L. Langenfelds, and R.J. Francey, (1996), Natural and anthropogenic changes in atmospheric CO2 over the last 1000 years from air in Antarctic ice and firn, J. Geophys. Res. 101, 4115–4128.
- Etheridge, D.M., L.P. Steele, R.J. Francey, and R.L. Langenfelds, (1998), Atmospheric methane between 1000 A.D. and present: Evidence of anthropogenic emissions and climate variability, J. Geophys. Res, *103*, 15,979-15,993.
- Hofmann, D. J., J. H. Butler, E. J. Dlugokencky, J. W. Elkins, K. Masarie, S. A. Montzka, and P. Tans, (2006a), The role of carbon dioxide in climate forcing from 1979 - 2004: Introduction of the Annual Greenhouse Gas Index, Tellus B, 58B, 614-619.
- IPCC (2014), Climate Change 2013: The Physical Science Basis. Cambridge Univ. Press, Cambridge UK and New York, NY USA.
- Keeling, C.D., (1958), The concentration and isotopic abundances of atmospheric carbon dioxide in rural areas,Geochimica et Cosmochimica Acta, 13, 322–334.
- Machida, T., T. Nakazawa, Y. Fujii, S. Aoki, and O. Watanabe, (1995), Increase in the atmospheric nitrous oxide concentration during the last 250 years, Geophys. Res. Lett., 22, 2921-2924.
- Montzka, S. A., E. J. Dlugokencky, and J. H. Butler, (2011), Non-CO2 greenhouse gases and climate change, Nature, 476, 43-50.
- Montzka, S. A., et al., (2018), A persistent and unexpected increase in global emissions of ozone-depleting CFC-11 Nature,557, 413-417. https://doi.org/10.1038/s41586-018-0106-2
- Nisbet, E. G., et al. (2016), Rising atmospheric methane: 2007–2014 growth and isotopic shift, Global Biogeochem. Cycles, 30, doi:10.1002/2016GB005406
- Nisbet, E. G., Manning, M. R., Dlugokencky, E. J., Fisher, R. E., Lowry, D., Michel, S. E., et al. (2019) Very strong atmospheric methane growth in the 4 years 2014–2017: Implications for the Paris Agreement. Global Biogeochemical Cycles, 33, 318–342. https://doi.org/10.1029/2018GB006009.
- Ramaswamy et al., (2001), Radiative Forcing of Climate Change, Chapter 6 in Climate Change 2001: The Scientific Basis.Cambridge Univ. Press, Cambridge UK and New York, NY USA.
- Schaefer, H., et al. (2016), A 21st century shift from fossil-fuel to biogenic methane emissions indicated by 13CH4, Science, 352, 80–84.
- Velders, G. J. M., S. O. Andersen, J. S. Daniel, D. W. Fahey, and M. McFarland, (2007), The importance of the Montreal Protocol in protecting climate, Proc. Nat. Acad. Sciences 104, 4814-4819.
22 May 2019
![]()