New Tool Enables Countries to Improve Their Food Systems.
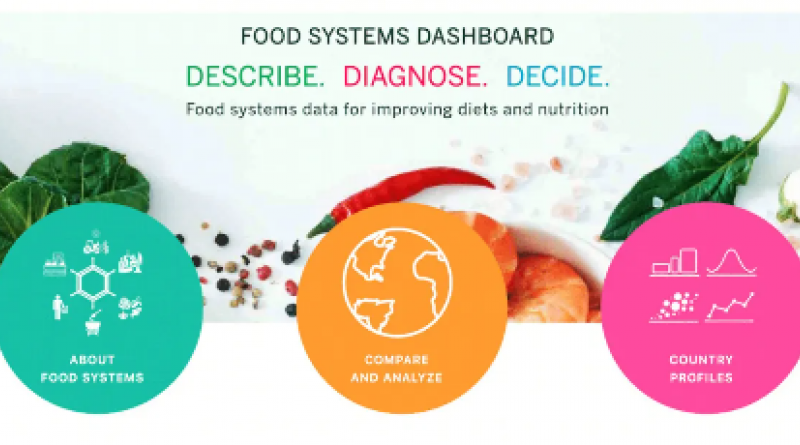
A new tool called The Food Systems Dashboard aims to save decision makers time and energy by painting a complete picture of a country's food system. Created by the Johns Hopkins' Alliance for a Healthier World, the Global Alliance for Improved Nutrition (GAIN), and the U.N. Food and Agriculture Organization (FAO), the Dashboard compiles food systems data from over 35 sources and offers it as a public good.
"Trying to fix a food system without data is like trying to fix a car engine without any light in the garage," says Lawrence Haddad, Executive Director of GAIN and one of the contributing partners behind the Dashboard.
The new Food Systems Dashboard enables government officials, policy makers, non-governmental organizations (NGOs), and others to see what is working in their food systems and what isn't.
The Dashboard has three main objectives — describe, diagnose, and decide. It presents data to describe a country's food system, help decision makers diagnose the problem areas in their systems, and suggest policies, programs, and interventions to address identified issues.
Pulling data on over 180 indicators, the Dashboard presents more than 230 countries' food systems. These indicators, which range from agriculture production factors to diet-related disease rates, are broken down into five broad categories: food supply chains, food environments, individual factors, consumer behavior, and outcomes. Of these indicators, the team also selected 41 measures they deem critical to describe a food system.
"We hope that the Dashboard not only draws attention to the importance of food systems in shaping development priorities, but that it also can be used as a data-driven problem solving tool for more difficult food system challenges that countries may face," Dr. Jessica Fanzo of Johns Hopkins University and Dr. Rebecca McLaren, global coordinator for the Dashboard, tell Food Tank.
The layout for each country's page presents information in simple, visual ways so that users are able to quickly understand and take away key messages. Users can then compare their food systems with those of other countries, either by region, income classification, or a food system typology.
The tool also highlights issues like consumer behavior, that require more research to generate usable data. Fanzo and partners hope the Dashboard will simultaneously serve as a tool for data advocacy and lead to more comprehensive global data collection.
In the future, the Dashboard will continue to develop as the team works to further identify specific challenges countries face, Fanzo and McLaren tell Food Tank. It will also increase focus on recommended policies, programs, investments, and other interventions targeted to those specific challenges, Fanzo and McLaren tell Food Tank.
"The Dashboard is open to all and will foster much needed cooperation in transforming our food systems," says FAO Director-General, QU Dongyu, "With the threats and opportunities presented by COVID-19, we need more collaboration between stakeholders who care about hunger, nutrition, livelihoods, climate, biodiversity, and sustainable natural resource use."
15 July 2020
Eco Watch