Australia: like a furnace.
Ferocious bushfires have been sweeping across Australia since September, fuelled by record-breaking temperatures, drought and wind. The country has always experienced fires, but this season has been horrific. A staggering 10 million hectares of land have been burned, at least 24 people have been killed and it has been reported that almost half a billion animals have perished.
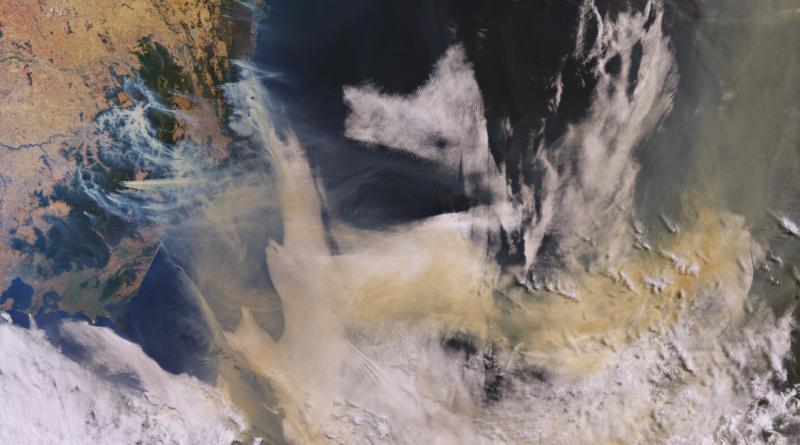
Photographs and film footage have without doubt left the world shocked, but the view from space shows the scale of what Australians are having to deal with.
New South Wales has been worst hit. The Copernicus Sentinel-3 image above shows smoke pouring from numerous fires in the state on 3 January.
While this image was captured by the mission’s ocean and land colour instrument, which offers camera-like images, the mission’s sea and land surface temperature radiometer instrument can record fire hotspots. This instrument works like a thermometer in the sky, measuring thermal infrared radiation to take the temperature of Earth’s land surfaces.
The instrument’s two dedicated fire channels are used to compile the World Fire Atlas.
The animation here shows how the number of fires increased between October and January. The measurements were taken by the Copernicus Sentinel-3A satellite at night only, and since the spatial resolution is limited to 1 km, the animation, as shocking as it is, actually underestimates the number of fires.
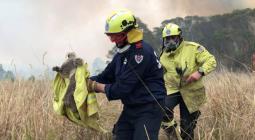
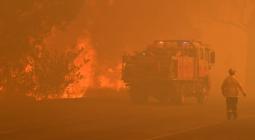
- Smoke and flames in Australia
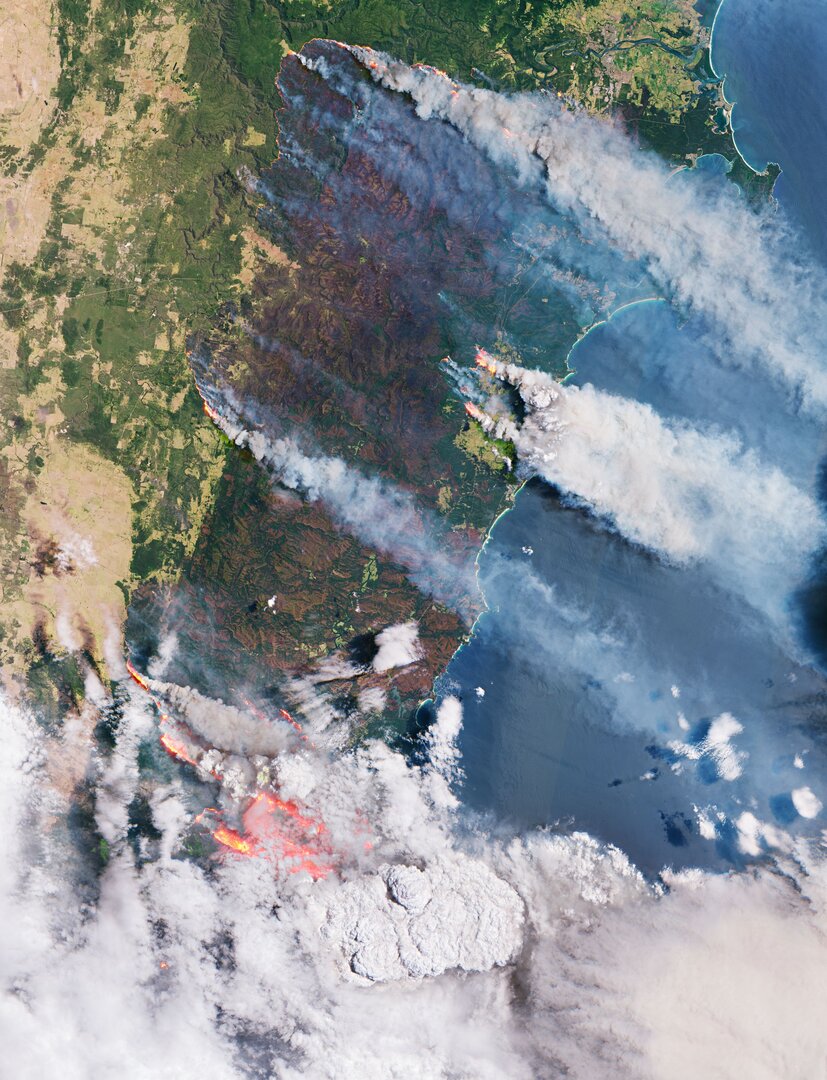
The Copernicus Sentinel-2 mission has also been used to image the fires. The Sentinel-2 satellites each carry just one instrument – a high-resolution multispectral imager with 13 spectral bands. The smoke, flames and burn scars can be seen clearly in the image shown here, which was captured on 31 December.
The fires have not only decimated the land, but they have also had a serious effect on air quality.
The Copernicus Sentinel-5 Precursor mission is dedicated to monitoring air pollution by measuring a multitude of trace gases that affect the air we breathe.
The animation shows increasing concentrations of carbon monoxide between September and December along Australia’s southeast coast.
Carbon monoxide is commonly associated with traffic, but here we see the increase in atmospheric concentrations owing to the fires. Naturally, once in the air, it can cause problems for humans by reducing the amount of oxygen that can be transported in the bloodstream.
According to Australia’s Bureau of Meteorology, 2019 was the country’s warmest year on record. The fires are thought to be down to this specific weather phenomena and climate change.
As the state of disaster now extends to Victoria, the danger, is, sadly, still not over.
9 January 2020
eesa