Analysis of the Energy Consumption Behavior of European RES Cooperative Members

Abstract
REScoops are cooperatives of renewable energy producers and/or consumers that are being formed in the developing European Smart Grid. Today, there are more than 2397 REScoops with more than 650,000 members. Their development indicates the necessity of producing and consuming green energy, assists the fight against energy poverty, and reduces greenhouse gas emissions by utilizing smart management systems and self-consumption techniques. An essential objective of the H2020 REScoop Plus project is to stimulate better understanding and promote the cooperatives’ commitment to behavioral change. To achieve such a goal, this paper presents the methodology adopted to assess the energy-saving activities and behavior of the REScoops. In order to obtain relevant conclusions, a detailed statistical analysis was undertaken. Moreover, the analysis led to an effective classification of the various members, providing insights regarding their contribution to consumption reduction according to various specific characteristics. The statistical analysis showed that REScoop members contribute significantly to energy conservation and the reduction of harmful gas emissions, and subsequently, the majority of the energy efficiency (EE) interventions led to achieving more than 20% reductions. Specific practices, already adopted by the REScoops, lead to increased energy efficiency and environmental benefits.
Keywords:
REScoops; EE interventions; actual consumption reduction; renewable energy cooperatives; performance analysis
1. Introduction
Global energy demand has risen to an unprecedented degree over the past century. Almost three-quarters of the energy consumed worldwide rely on fossil fuels. The burning of fossil fuels is a major contributor to the climate change negatively impacting humankind. In a European context, the term fuel poverty has become to define households not able to heat their houses sufficiently due to the high cost [1]. With the increasing pollution of the biosphere, the development of renewable energy (RE) has become a major societal challenge. Though increasing the share of RE is high on the policy agenda, the general public had been slow to adopt it [2] since the formation of REScoops. On the other hand, one of the most noteworthy parts of the existing energy market is the European renewable energy sources cooperatives (REScoops) [3]. This definition has been adopted from the International Cooperative Alliance (ICA) Statement on Cooperative Identity 1995, thus it represents 1 billion members of cooperatives worldwide. Cooperatives have a number of competitive benefits in producing, providing and distributing energy. They are often community-based organizations, and consequently, they deliver democratic local control over energy issues. They can also negotiate an effective model for rural electrification and can effectively connect locally available, decentralized renewable energy [4].
The year 2012 was both the United Nations International Year of Cooperatives and the United Nations International Year of Sustainable EnergyEnergy is a growth matter, and guaranteeing that people have access to a satisfactory supply of high-quality energy is vital to achieving sustainable economic, social and environmental growth. Therefore, energy cooperatives were regarded as drivers of sustainable growth and energy poverty reduction, and access to energy was also regarded as a critical issue for development processes [4].
Cooperatives serve broad geographical areas, thus making them reliable in providing their members with sufficient high-quality electric power. They are able to keep the frequency and the duration of power outages low, due to both their expertise in rural electricity and their incentive to invest regularly in the improvement and repair of their technology equipment [5].
The formation of REScoops in the European Union began some years ago, providing their members the opportunity to buy renewably generated electricity at fair prices, to interact democratically with other members and co-decide the cooperative’s future, and to be autonomous and independent with respect to energy [6,7,8].
Hundreds of energy cooperatives are now active in Europe, the USA and Australia. Several of these represent successful instances of an approach towards energy independence for their communities and the development of the local economies regarding the –misuse of domestic energy sources. Sifnos Island Cooperative has initiated an effort to claim the energy independence of the insular community on the autonomous island of Sifnos in Greece [9].
Today, there are more than 2397 REScoops, with more than 650,000 members [10,11,12]. Citizens jointly investing in and operating renewable energy installations, through renewable energy cooperatives, play an essential role in some European countries [13]. Residential solar system installations make up a significant portion of the overall solar growth [14] and through REScoops’ actions, this is due to increase further in the near future. For example, Spanish renewable energy sources (RES) cooperatives frequently join forces in sharing education courses and experiences, while also trying to spread new ideas at both social and political levels. However, notwithstanding their growth and regional spread over the last few years, RES cooperatives still have a minor presence in the Spanish energy system [15,16].
In addition, there are some optimistic scenarios in which every city implements a renewable energy cooperative; for example, it is projected that in the Port of Rotterdam, once the first renewable energy systems are implemented, with the aid of smart business models, the initial financial situation of the cooperative will steadily be upgraded and with these funds, it will be able to expand its staff to increase its impact and lead the energy transition in the port [17].
Growing concerns about climate change impacts on humans and eco-systems are motivating the exploration of new strategies to complement traditional climate policies such as mitigation and adaptation [18]. Energy cooperatives have been an important building block in the energy transition in various European countries, although their practical importance is neither quantitatively nor qualitatively reflected in the academic literature [19]. The systematic design of an energy supply/demand structure has become an increasingly important issue relating to sustainability [20].
Although the activities that REScoops undertake, resemble those of other organizations to some extent and due to their particular organizational and business models as citizens’ initiatives, i.e., their cooperative model, REScoops are thought to be very well-positioned to undertake activities to influence and help their members to save energy. Given these features and benefits, REScoops organize events, such as meetings and conventions in order to raise their members’ energy awareness [11,21].
As an outcome, it is expected that when end-users participate in an energy cooperative, they become more thoughtful regarding energy conservation and efficiency [16,22]. To this end, the REScoop Plus project aims to gather available information and data from various European REScoops, and demonstrate that participation in such a cooperative raises energy awareness and contributes to accomplishing the challenging goal of energy efficiency [10,23].
On the other hand, renewable energy cooperatives may face some difficulties, such as capital market regulation, a lack of full-time staff, a lack of active voluntary involvement, the transformation of business models, financing, etc. These may act as inhibiting factors that not only threaten the cooperatives’ aims but also impact the emotional health of the people who are actively involved. Such impacts may result in frustration, helplessness and a sense of being overwhelmed. It is apparent that local support and help is of high importance for cooperatives in order to operate smoothly [23,24].
This paper focuses on describing the process by which energy conservation and efficiency can be investigated from an informational (data-centered) point of view. The outcomes of the statistical analysis showed that REScoop members contributed significantly to energy conservation and the reduction of harmful gas emissions. Also, the adoption of specific practices led to increased energy efficiency and environmental benefits. There is insufficient literature regarding REScoops and the existing studies do not provide data and results regarding the behavior of their customers and members. This paper takes a forward-thinking approach in providing, for the first time, a systematic behavioral analysis of REScoops’ customers, as presented in the results section.
2. Presentation of the Methodology
2.1. Main Steps
The core aim of this work was to statistically evaluate: (a) the impacts of proposed energy efficiency (EE) interventions in terms of decreased energy consumption; and (b) underline the most effective EE interventions in a recommendations toolkit. This toolkit can be considered as a practical guide for newly formed cooperatives, in order to achieve even better performance in meeting energy consumption reduction targets. The following steps were taken to achieve these goals:-
Share information and knowledge regarding data storage and handling, and consumption reduction behavior, among REScoops.
-
Identify and record existing datasets and their formats.
-
Determine a common data format for all cooperatives. This included the definition of a data structure, as well as the fields that would contain the various measurements.
-
Gather the available datasets of the supplying REScoops (questionnaire, survey, interviews, and meetings with the data experts).
- Initial statistical analysis of the historical data before the initiation of the REScoop Plus project. This step would give us a first glimpse of what generally happened to the consumption of the cooperative members, and how existing EE interventions were being applied. The results would help identify:
- (a) Whether reduction was indeed taking place in REScoops;
- (b) Potential key factors for consumption reduction.
Then, the following factors were taken into consideration to help identify good behavioral practices and EE interventions
-
Application of specific EE interventions to certain members and groups of members.
-
Gathering available datasets after the application of the EE interventions.
-
Final statistical analysis of the impact of each EE measure on the consumption of end-users.
These steps characterized the efficiency of each proposed EE intervention and helped enrich the recommendations toolkit offered to REScoops.
2.2. Data Collection and Pre-Processing
A critical task of our research was to collect data from REScoops over a long period after implementation of the “best energy efficiency practices” and perform a comprehensive statistical analysis in order to characterize the effectiveness of these interventions.
In the next section, the main difficulties that REScoops had in gathering and submitting the datasets and the additional pre-processing that had to be performed by the research team, are described. Seven REScoops participated in the data submission process, namely: (i) EBO from Denmark; (ii) ECOPOWER from Belgium; (iii) ENERCOOP from France; (iv) SOMENERGIA from Spain; (v) SEV from Italy; (vi) ENOSTRA (AVANZI) from Italy; and (vii) COOPERNICO from Portugal [12].
Several challenges concerning the data processing were encountered during the analysis (e.g., some REScoops were new, while others improved their data collection system during the project). The problems were dealt with by filling in for missing data (whenever this was possible following accepted statistical techniques), creating new variables and using the most appropriate statistical tests/indexes per case.
Regarding the young cooperatives, ENOSTRA and COOPERNICO, had short customer-member lists, since they were newly formed. We must note that, in general, newly formed REScoops faced many vital tasks regarding the cooperative’s constitution, the need to overcome legal barriers where these exist etc., so their expansion to new customers and members may have been of secondary concern in this early stage. In addition, automatized systems for data collection and analysis were not set up, thus the process was quite time-consuming as it had to be performed manually. Often this meant having to combine different data sources; e.g., by analyzing the data of the Distribution System Operator (DSO) and extracting consumption information from the billing system. Nevertheless, both cooperatives contributed to our research, by submitting their available measurements.
Regarding the older and more established cooperatives, important challenges existed there too. First of all, their data collection and storage systems did not share a common data format and data restructuring was imperative in most cases. Also, the granularity of the stored measurements varied from 15-min intervals to yearly values. We stressed that monthly values would be best for the purpose of the project, due to the restricted time horizon of REScoop Plus. However, in cases where monthly data were not available, the analysis was performed using semi-annual or/and yearly measurements.
Another difficulty the research team (and REScoops) faced was the retrieval of meteorological data. Being mainly energy companies, the REScoops rarely stored weather measurements such as air temperature, precipitation and degree days, thus, third-party services had to be incorporated in the collection of such data. Regardless of this fact, most cooperatives supported our efforts with the successful submission of meteorological data. For the remaining REScoops, the research team filled in the missing meteorological data wherever possible by exploiting globally accepted tools, such as METEONORMTM.
The most difficult part of the data collection procedure turned out to be the submission of demographic data. Values such as the building’s surface in square meters, as well as the number of residents, were very important for acquiring the normalized consumption indices. These indices were necessary for reasonable analysis and comparison (e.g., of electricity consumption) among REScoops. The main issue with the collection of such data was that they are not publicly available (except for rare cases, e.g., building characteristics in Denmark), and have to be retrieved with personal questionnaires sent to each individual household/business. Despite this fact, most REScoops submitted demographics. For the rest of the REScoops, the research team filled in the missing demographic data (apart from a few cases where this was indeed impossible to obtain).
Finally, the size of the datasets submitted was not a serious problem in the statistical analysis.
2.3. Statistical Analysis
The purpose of this section is to provide information/knowledge regarding the key part of this report. Specifically, the methods that were utilized in order to carry out the statistical data analysis, the typical values that were computed, the characteristics according to which certain groupings of the population were performed, and the way in which the reduction of electricity consumption was estimated, with respect to several intervention measures.
2.3.1. Calculation of Typical Values
We computed the average value of energy consumption in kWh for various groups, by summing across the values of all relevant measurements and then dividing by their total number (sample size). Thus, the computed average values are un-weighted. Furthermore, in order to gain better insight into energy consumption, we also performed normalization with respect to other characteristics, e.g., the number of residents. Such normalization is important when the monthly energy consumption, in kWh, varies among different households due to factors such as the number of inhabitants, the geographical region of residence etc. In some cases, we conducted normalization with respect to two features, e.g., heating degree days (HDD) and m2. This was performed by dividing the energy consumption measurement in kWh by the product of the values of the two features. Specifically, we calculated indices such as:-
Average monthly electricity consumption in kWh normalized by heating degree days (Avg. kWh/HDD);
-
Average monthly heating energy consumption in kWh normalized by HDDs (Avg. kWh/HDD).
2.3.2. Population Division in Groups
Naturally, a population of interest is not homogeneous with respect to various characteristics. Therefore, it is meaningful to divide the population into distinct groups and try to compare these groups w.r.t different characteristics/variables. In the context of our statistical analysis, the most meaningful differentiation was according to whether a consumer had received an energy efficiency intervention or not. However, in our statistical analysis we also performed a number of group divisions, according to the following features:-
Cooperative and non-cooperative members;
- Energy efficiency measure:
- ○ Leaflets
- ○ Technical support
- ○ Software solutions
- ○ Engagement activities
- ○ Smart metering installation;
- Tariffs:
- ○ Special
- ○ Flat
- ○ Time of use.
Note that this list was populated according to the available data submitted by the REScoops, and may be a good example for the new REScoops to adopt. However, it is not exhaustive and should be subject to change according to the guidelines provided in D2.1 (Zero-point report on data of Supplying REScoops) and D2.2 (Methodology for Analysis), and to data availability for each new REScoop, i.e., which measurements they store.
2.3.3. Reductions Calculation
In order to estimate the impact of the interventions on energy consumption, the energy reduction before and after their application and after their application was calculated. The reductions were computed in both absolute values and percentages in order to evaluate their importance.
2.3.4. Statistical Methods
In our statistical-analysis we used two statistical methods/measures, namely ANOVA [25] and correlation coefficients (Pearson’s correlation coefficient and Kendall’s tau coefficient [26]) which provided us with valuable information mainly regarding the impact of EE interventions on the kWh consumption.
We used two correlation coefficients:-
The Pearson product-moment correlation coefficient (r, R, or Pearson’s r) is a measure of the strength and direction of the linear relationship between two quantitative variables (e.g., actual consumption and monthly bill charged). For its computation, several assumptions needed to be satisfied (namely, level of measurement, related pairs, absence of outliers, normality of the dependent variable, linearity and homoscedasticity).
-
Kendall’s tau (nonparametric) coefficient was used to measure the relationship between rankings of ordinal variables.
In addition, the non-parametric Chi-Square test of independence was used several times to determine if there was a significant relationship between two nominal (categorical) variables (e.g., meteorological region and smart metering installation users). The data were displayed in a contingency table. The null hypothesis for the test was that there was no association between the two variables/characteristics.
The critical value for the chi-square statistic is determined by the level of significance (typically 0.05) and the degrees of freedom. If the observed chi-square test statistic is greater than the critical value (or the p-value is less than 0.05), the null hypothesis can be rejected [25,26].
3. Results
Τhe results of the statistical-analysis on the impacts of EE interventions on the energy demands of the clients of each REScoop are presented below.
3.1. SEV—Italy
SEV is a cooperative from Italy originally founded in 1998. It is an association of renewable energy producers and distributors in the South Tyrolean area and is governed as a cooperative. Its 300 members are producers and distributors of heat and electricity. Most of them are cooperatives, some public and others private. Ten people worked directly for SEV; however, including the members, hundreds of people were involved in supplying and producing clean energy [22].
The results presented were derived from the statistical analyses of two (2) representative customers (schools), indicated by Best Practice 1 and Best Practice 2. Highlights of the dataset are presented in Table 1.
Table 1. Highlights of SEV’s dataset.
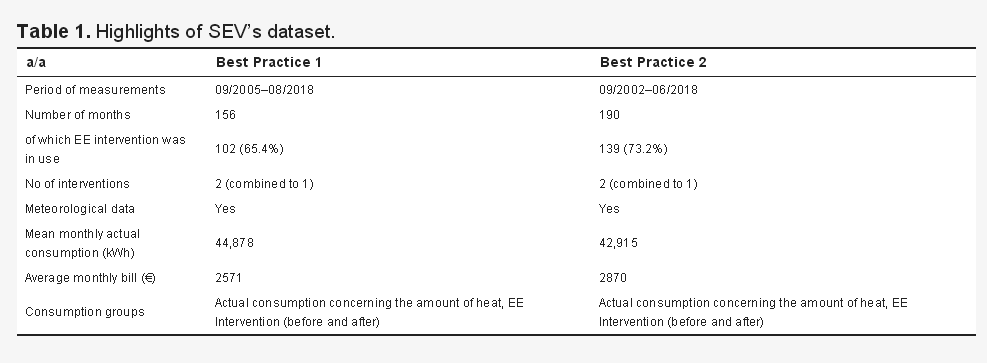
The proposed interventions were a combination of (a) a smart meter installation, and (b) the hydraulic balance of optimal temperature.
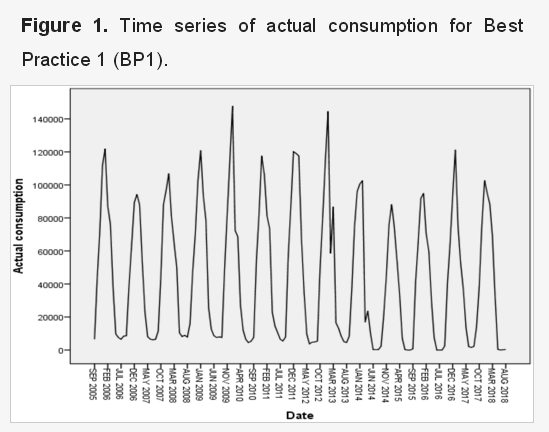
3.1.1. Best Practice 1
Best Practice 1 (BP1) was a school for which SEV provided 156 monthly measurements, 102 of which were during the use of their proposed intervention.
The actual consumption is a periodic time series (12-month period) with the maximum occurring in December/January and the minimum in June (Figure 1). There is a noticeable decrease in actual consumption in the winters of 2014, 2015, and 2016.
Figure 1. Time series of actual consumption for Best Practice 1 (BP1).
There was a strong, statistically significant, negative correlation, between actual consumption and the average daily temperature (r = −0.594, sig = 0.000, α = 0.05); i.e., an increase in average daily temperature was followed (usually) by a decrease in actual consumption. There was also a noticeable difference in actual consumption before and after implementation of the proposed EE intervention (27.8% reduction in energy consumption) and this can be converted into 5.57 tnCO2. That is, there was a statistically significant difference (sig = 0.042, α = 0.10) in actual consumption between the months without the EE intervention and the months with the EE intervention (49,659 compared to 35,847 kWh).