Seeing is Believing
For those who still doubt climate change
“Climate is what we expect. Weather is what we get.” Mark Twain was right. But these days, we need to update his observation: weather is what we notice; climate is what we ignore. Weather happens at the human scale; climate happens at the scale of civilizations. It’s been easy, with day-to-day variations, to focus on the immediate and ignore the trends. That’s why it helps to find ways to visualize what’s going on. NASA has recently posted some visual aids to do that. This is not about IPCC estimates. It’s not about arguments over how much of our climate change is due to human action. It’s not about predictions. It’s data: what have we been doing, and what has the world been doing around us. Draw your own conclusions.
Weather is what we notice; climate is what we ignore.
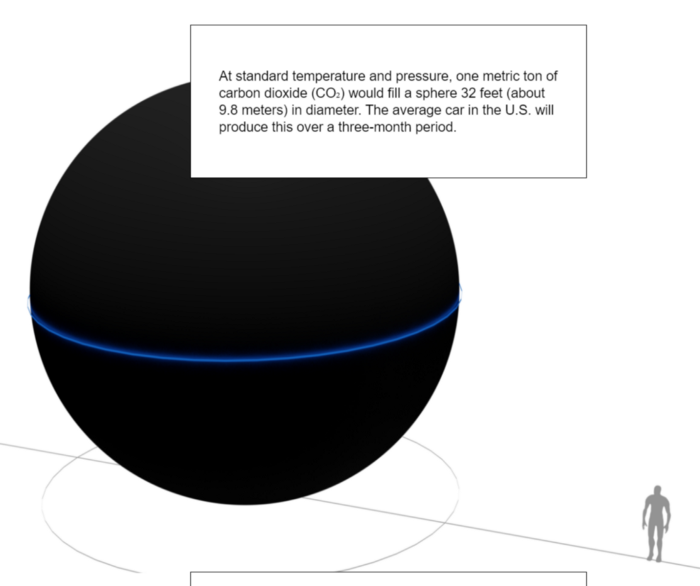
First, what have we been doing? We’ve been dumping a lot of carbon into the atmosphere. The average car in the U.S. puts about this much carbon dioxide into the atmosphere every three months:
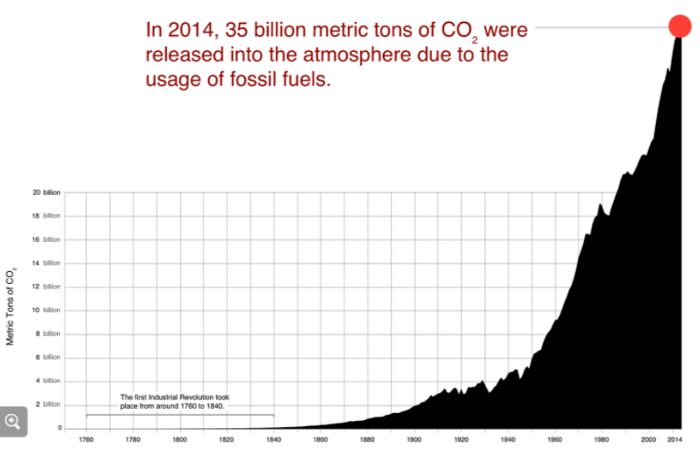
With the industrial revolution, the levels of carbon dioxide in our atmosphere rose precipitously.
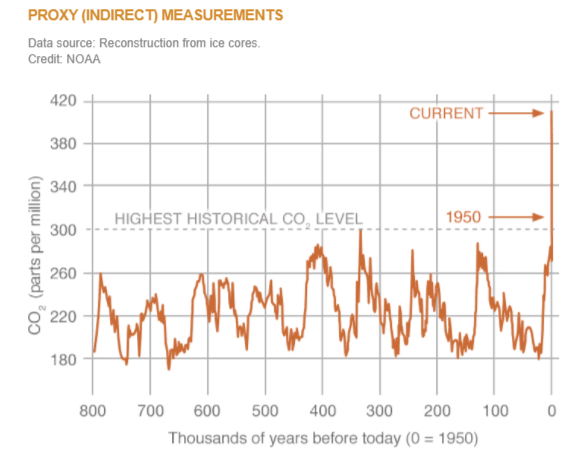
And while atmospheric levels have varied over time, nothing close to the levels we see now has happened before in the lifetime of human civilization. And while net human emissions of carbon dioxide must approach zero in order to stabilize global mean temperature at the level set as a goal in existing international agreements, there is no indication that this trend will reverse.
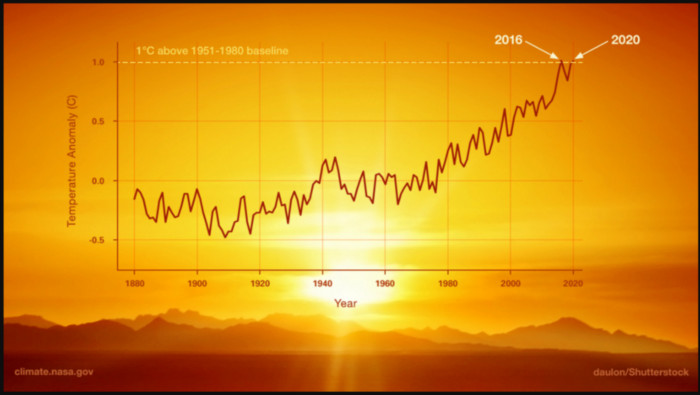
Despite years of consciousness-raising and negotiations, roughly half of all the fossil fuel burning infrastructure on this planet has been installed since 2004, with much more on the way. As the most general understanding of the effects of extra carbon in the atmosphere would lead one to expect — a general relationship that has been observed and commented upon since the early 19th century — this increase in atmospheric carbon dioxide has been matched by a rise in global temperatures.
Ignore the detail of the various models, if you wish. All of them predict a continued increase. The models differ on how much temperature will increase, as well as on how much we might expect to limit further carbon emissions. But all agree: the situation is serious, and it’s going to get worse.
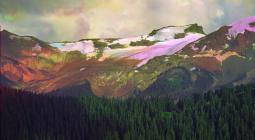
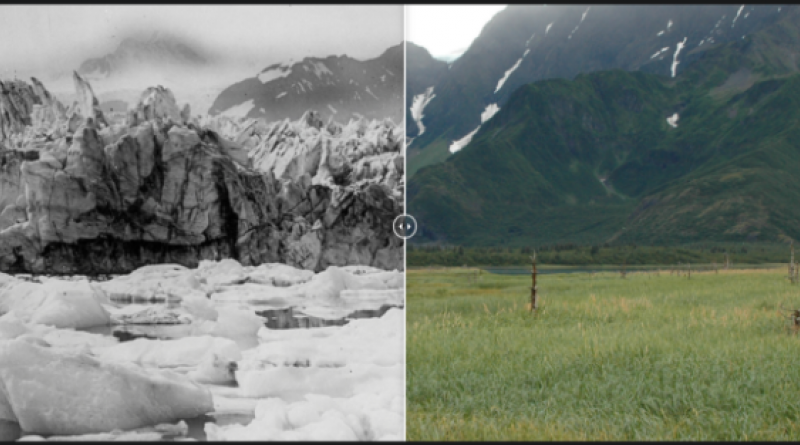
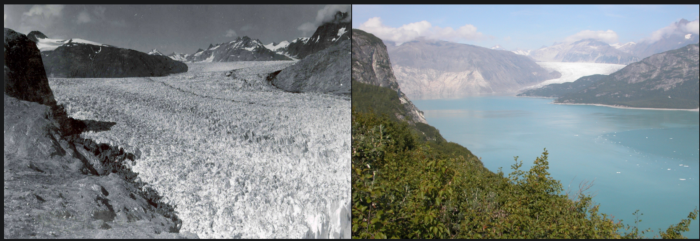
Meanwhile, we can see the effects around us. It can be found in retreating glaciers in Alaska
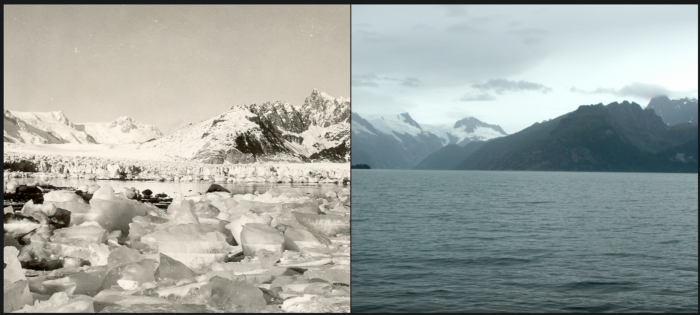
c.1930 and 2005, courtesy of NASA
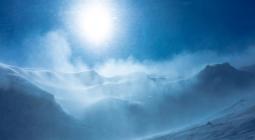
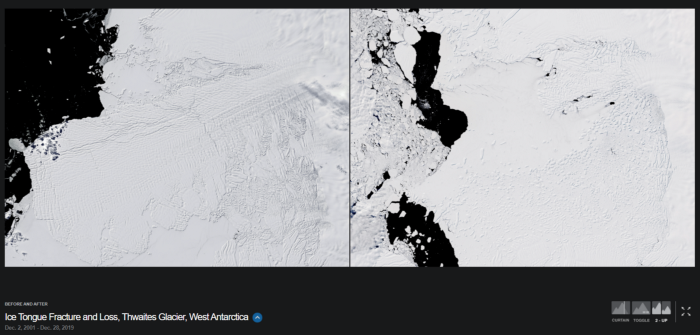
and the shelf of Antarctica
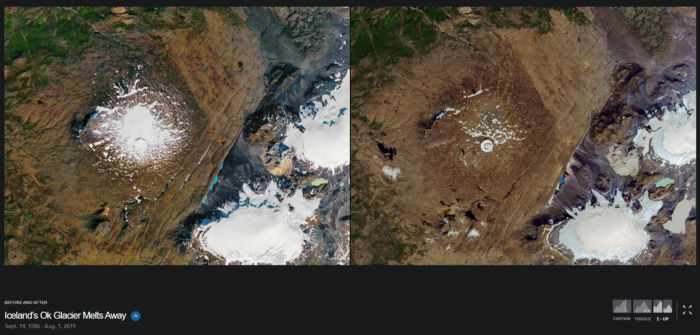
and the lost glaciers of Iceland.
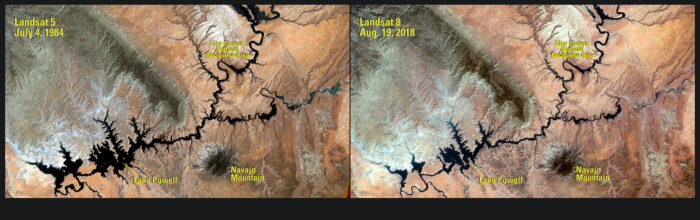
The climate-related drought in the Western U.S. has shrunk Lake Powell
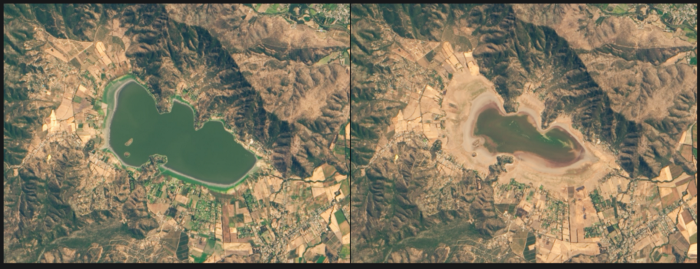
as well as Chile’s Lake Aceleo.
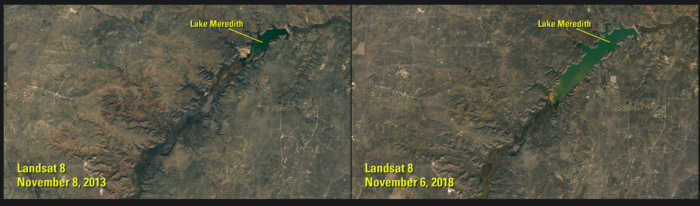
At the same time, as weather patterns pushes water into new regions it expands some lakes and floods the plains, as seen in Texas
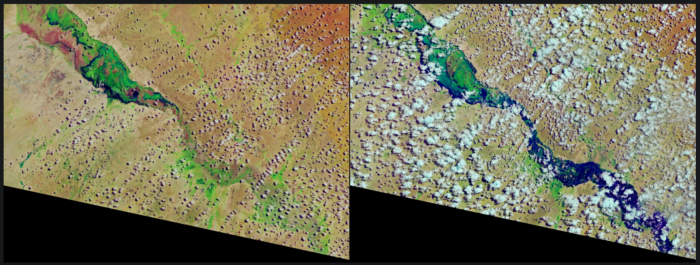
and Somalia.
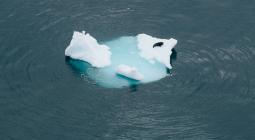
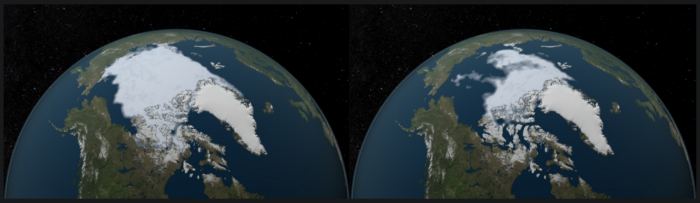
Perhaps the most obvious change is the loss of ice in the arctic
and the ever-rising rising sea levels.
demcintosh.medium.com